Stuck in the middle with you: Peri-urban areas and the food system
Peri-urban areas are an inherently difficult concept to define: they are neither totally rural, nor are they fully urban. They are associated with sprawl and with suburban development. While definitions and theories vary, most agree that peri-urban areas are dynamic transition zones between the city and countryside, display diverse land uses and uneven development, and operate under many different jurisdictions. Indeed, scholars and researchers have recognized that the urban-rural binary is not helpful and that peri-urban areas are part of a continuous spectrum from urban core to rural periphery. Using these characteristics as a starting point, we worked to outline these understudied areas as part of a USDA–funded project in order to increase the understanding of what role peri-urban areas play in the food system.
Let’s start with peri-urban areas surrounding Baltimore as an example: First, we identified the characteristics we wanted to map. Using the existing literature, we identified zoning, commuting, and population density as three key indicators for peri-urban areas. Zoning helps to identify local designations of land use – e.g, rural, residential, agricultural, et cetera. Commuting patterns show the flow of people as they move from home to work and back. Population density tells us just how densely the land is being settled. Looking at all three together helps us begin to shed light on these unmanaged and unplanned areas.
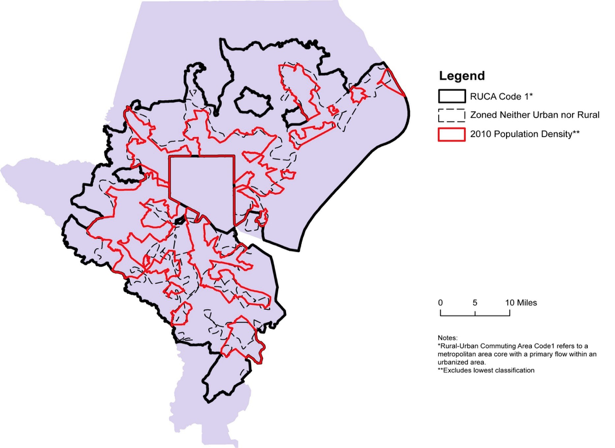
Next, we searched for publically available datasets of these three characteristics. For the four counties surrounding Baltimore (Anne Arundel, Howard, Harford, and Baltimore counties), we collected zoning data from each county’s website and mapped all the rural residential and agricultural areas. We then pulled and mapped commuting data from the USDA and population density figures from the US Census. Together, the outlines of the three overlapping datasets appear as at right. In order to make sense of this cartographic bowl of spaghetti we separated the overlapping areas into five zones based on how many outlines overlapped.
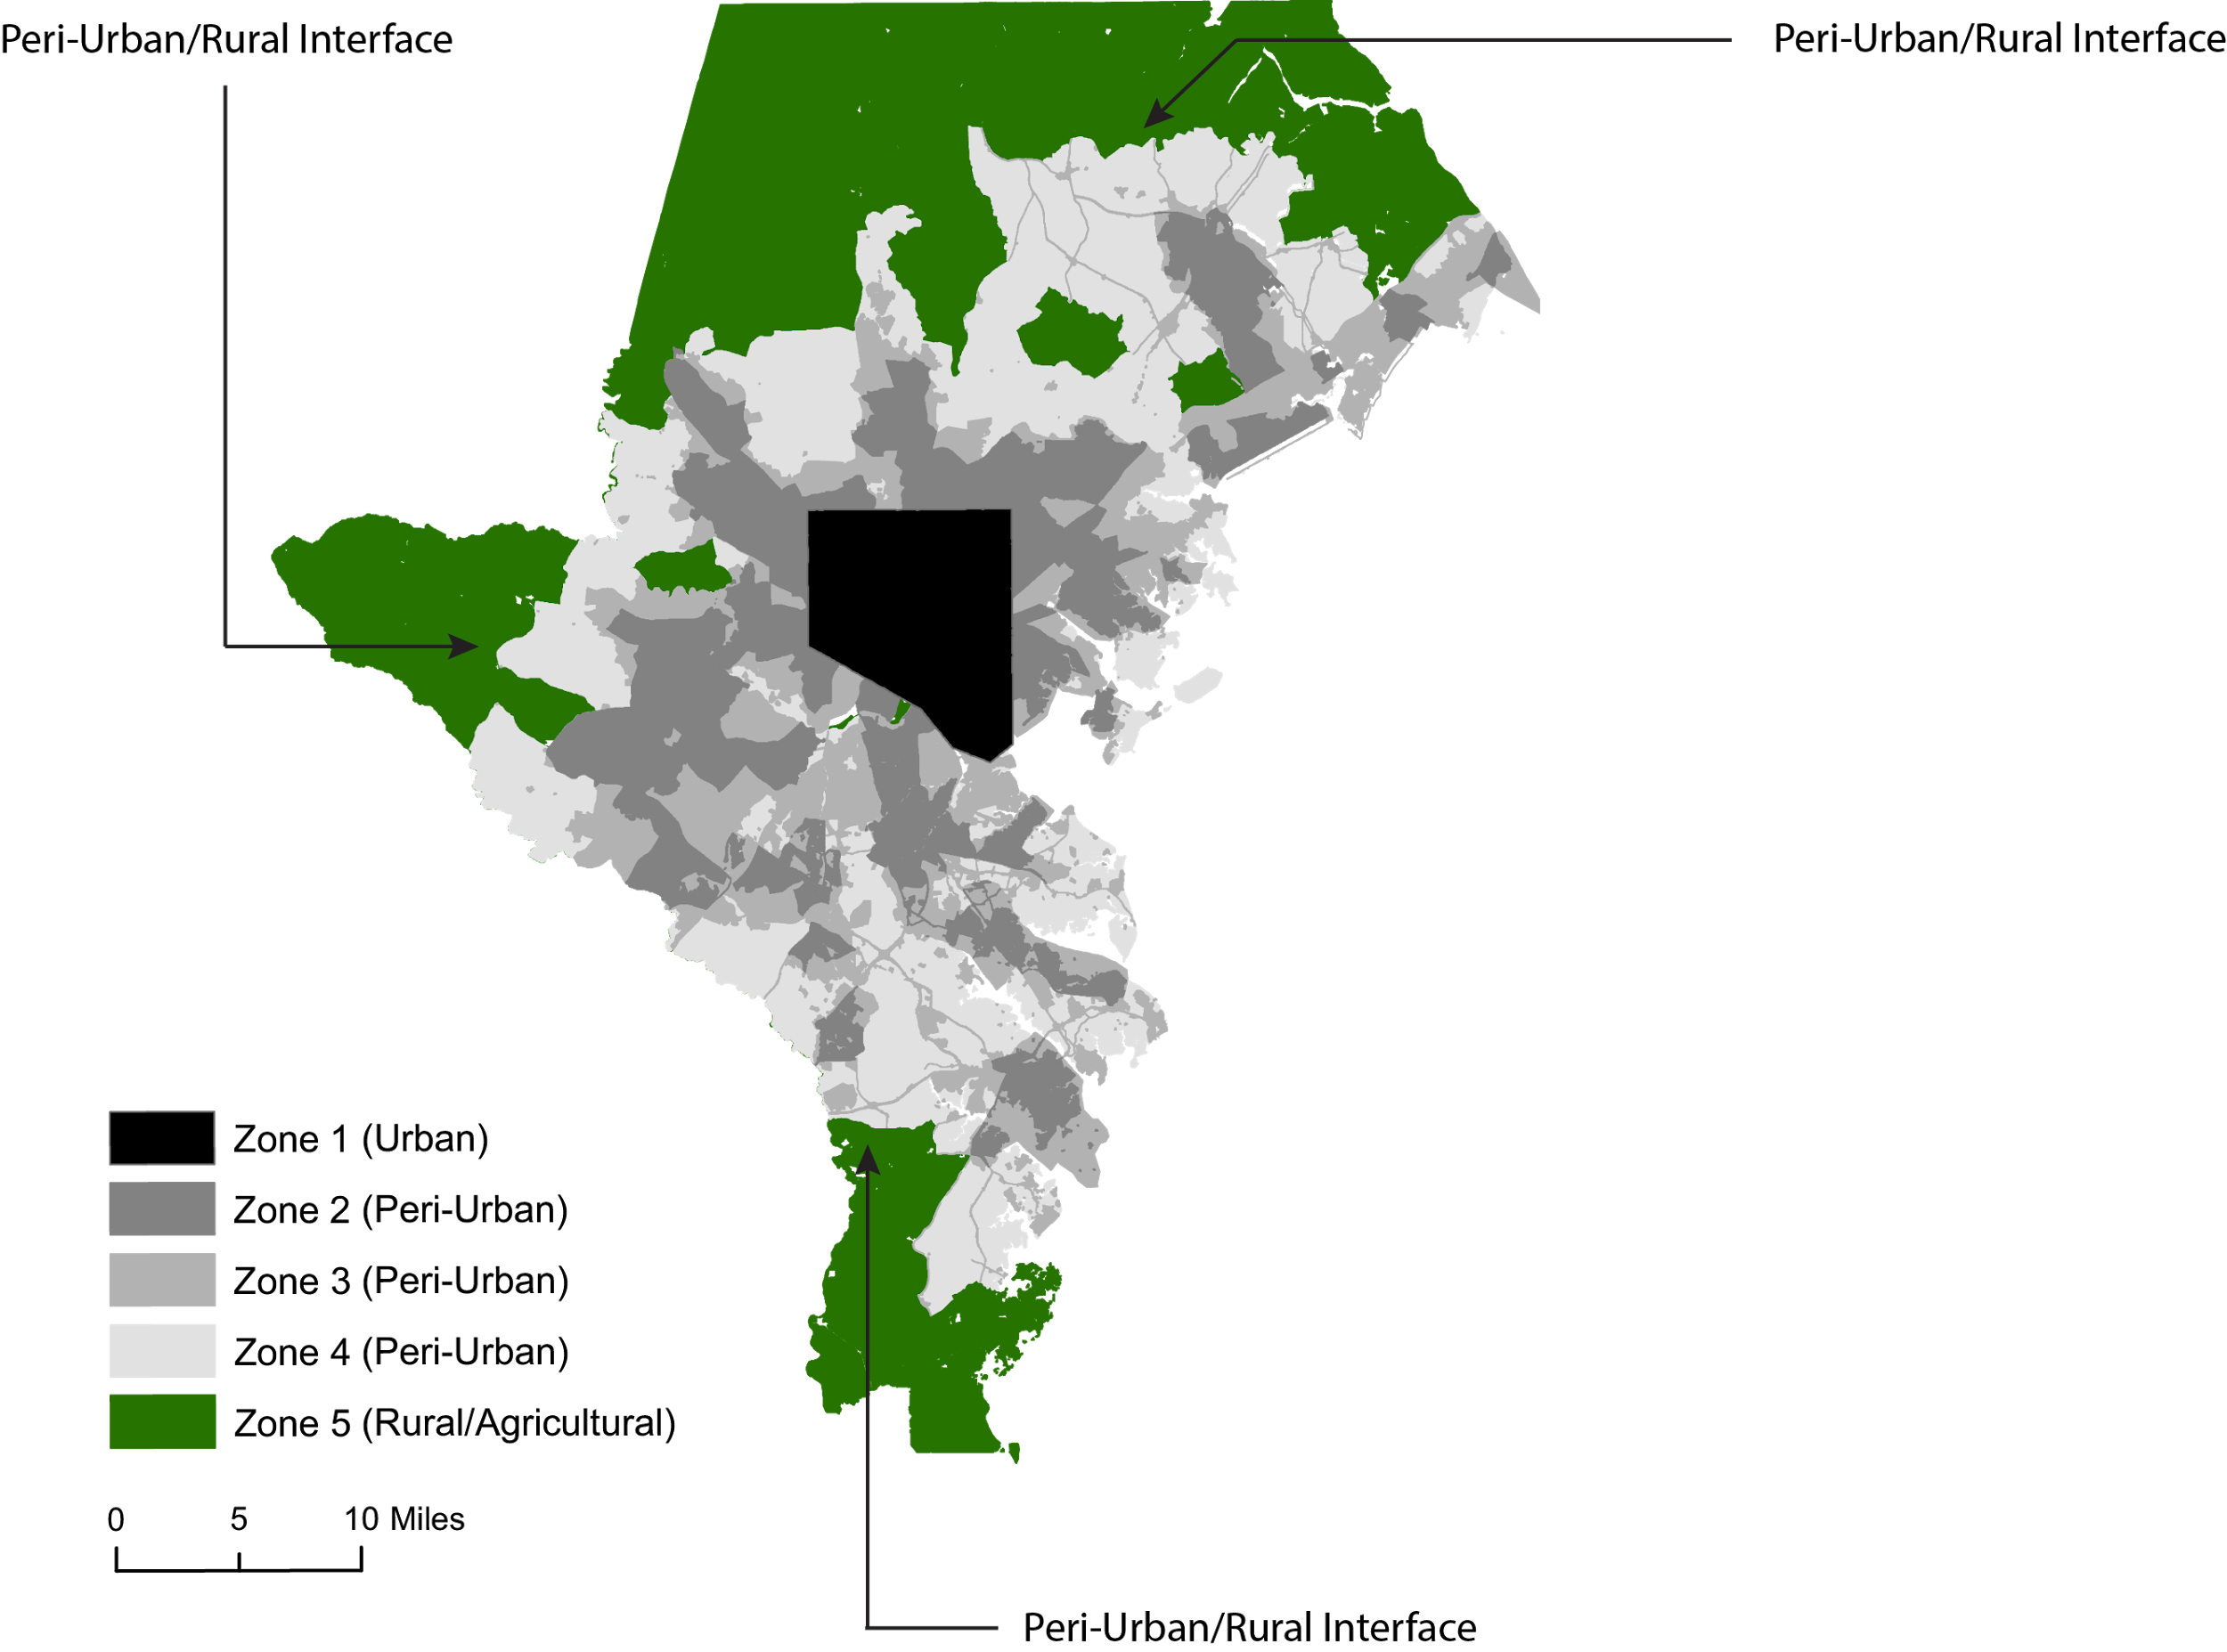
The map below shows these five zones with the peri-urban areas broken down into three zones:
- All three boundaries overlap: heavy intensity of use; labeled Zone 2
- Two of the three boundaries overlap: medium intensity of use; labeled Zone 3
- One boundary only: low intensity of use; labeled Zone 4
Zone 1 represents the urban area of Baltimore and Zone 5 represents rural/agricultural areas.
 Once we outlined the peri-urban zones, we began to analyze the distribution of various parts of the food system within the greater Baltimore area. To do this we used the North American Industry Classification System (NAICS) codes for all businesses related to agricultural production (e.g. fruit and vegetable farming, cattle ranching), processing, wholesale, retail, and storage of agricultural goods. The map below gives you a sense of the spatial distribution of these businesses across the area of study, while the pie charts that follow provide a detailed breakdown of the distribution of these five categories of agricultural businesses within each zone.

What the charts show us is that peri-urban areas play a large role in the food system; particularly for business involved in the intermediate stages of the food supply chain, such as processing and storage. In the case of processing, 61 percent of businesses can be found in the combined peri-urban zones, Zones 2-4. The food storage businesses display a similar trend, with 75 percent of businesses located within peri-urban areas. Interestingly, the peri-urban areas display a large share of production with 51 percent of businesses located in Zones 2-4. While it could be argued that Zone 4 is by and large a rural/agricultural area with high urban commuting, Zones 2 and 3 still display a notable contribution of agricultural production business at a combined 24 percent.
So what does outlining peri-urban areas tell us about our food system? Firstly, the peri-urban zones outlined above help delineate areas that are under pressure from changes in population, commuting patterns, or zoning. For example, because of the proximity of Zones 2 and 3 to Baltimore, agricultural businesses in these zones are subject to higher population and developmental pressure than businesses in Zones 4 and 5, putting them more at risk of displacement. Economic development agencies, regional planning organizations, food policy councils or other community groups can use this information to identify resources and existing infrastructure in areas most at risk of displacement, such as processing and distribution facilities. Secondly, while our study used NAICS codes, other local data on community gardens, farms, and farmers markets, or other business data could be used as well.
Finally, given that peri-urban areas span multiple jurisdictions, such as counties and townships, a strong case can be made for multi-jurisdictional management and planning. This type of planning ensures that different jurisdictions work together to identify and view their resources holistically, as part of one larger system. An important aspect of this research is that it provides boundaries to areas previously considered amorphous and invisible. Indeed, peri-urban areas seem to fall through the cracks, as they escape both the administrative purview of urban municipalities and the legislative focus of rural areas at the state and federal levels. Food policy councils can work with their regional planning commission or local government to bring attention to these important boundaries and their contribution to the agricultural economy of a region. This continued absence of coordination results in piecemeal and ad-hoc approaches that leave these areas and the important role they play in food systems vulnerable and insecure.
This research was funded through the US Department of Agriculture’s Enhancing Food Security in the Northeast through Regional Food Systems (EFSNE) project, USDA Grant # 2011-68004-30057. For more information about the project, please visit http://agsci.psu.edu/research/food-security.