Data Collection and Sharing during Pandemic: Opportunities and Evolution
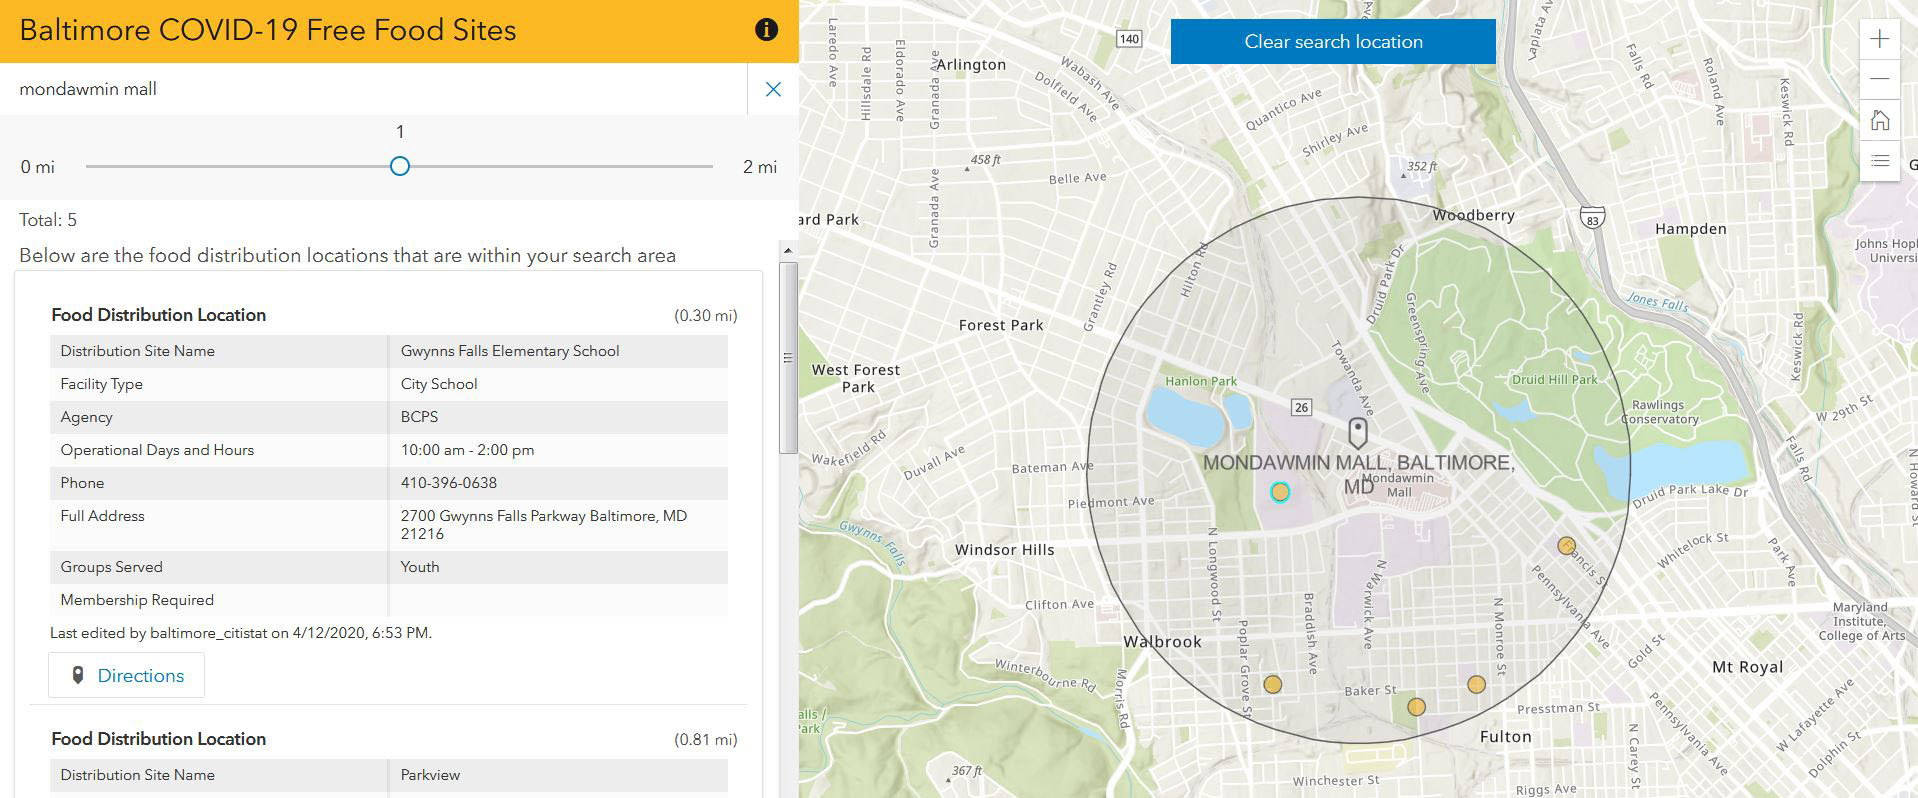
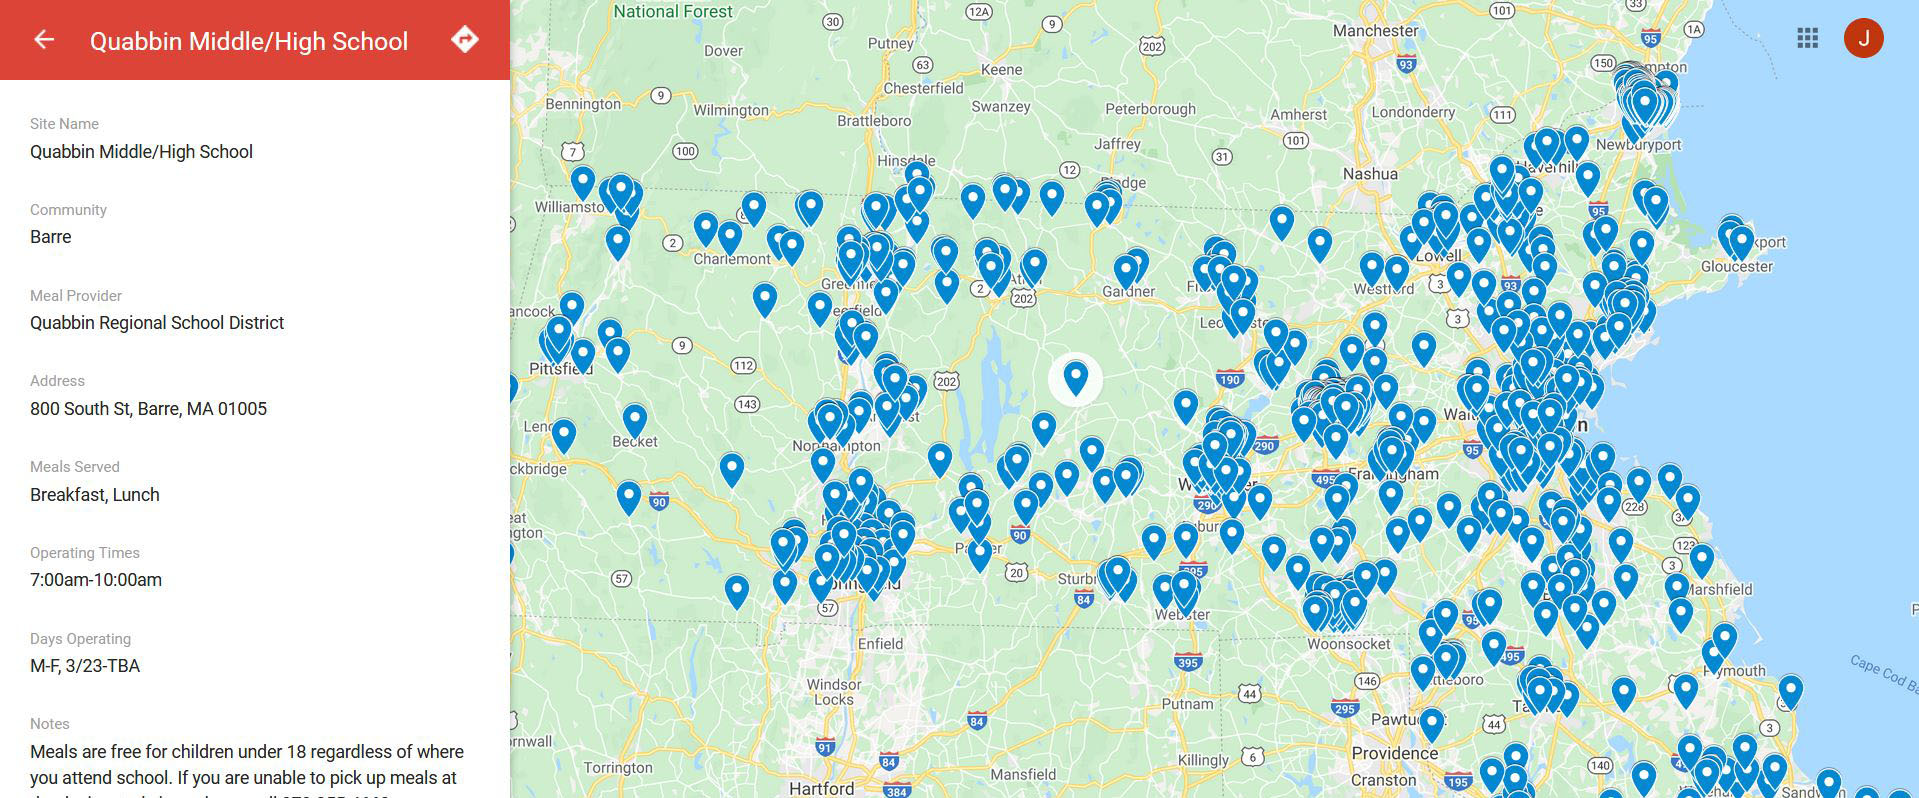
BALTIMORE—April 14, 2020. Over these past four weeks, Maryland has been “sheltering in place,” which has presented new challenges and needs. But we have seen some innovative methods for collecting and sharing data to address those needs. One of the most visible examples is the Johns Hopkins University COVID-19 Map. We have also seen more maps and dashboards being employed by communities as they address issues in their food system related to the protective measures taken to slow down the spread of the coronavirus. The most common way maps are being used is to show people where to find food distribution sites. This has been critical particularly in areas where students who typically rely on free and reduced price meals no longer have access to these meals as a result of schools being closed.
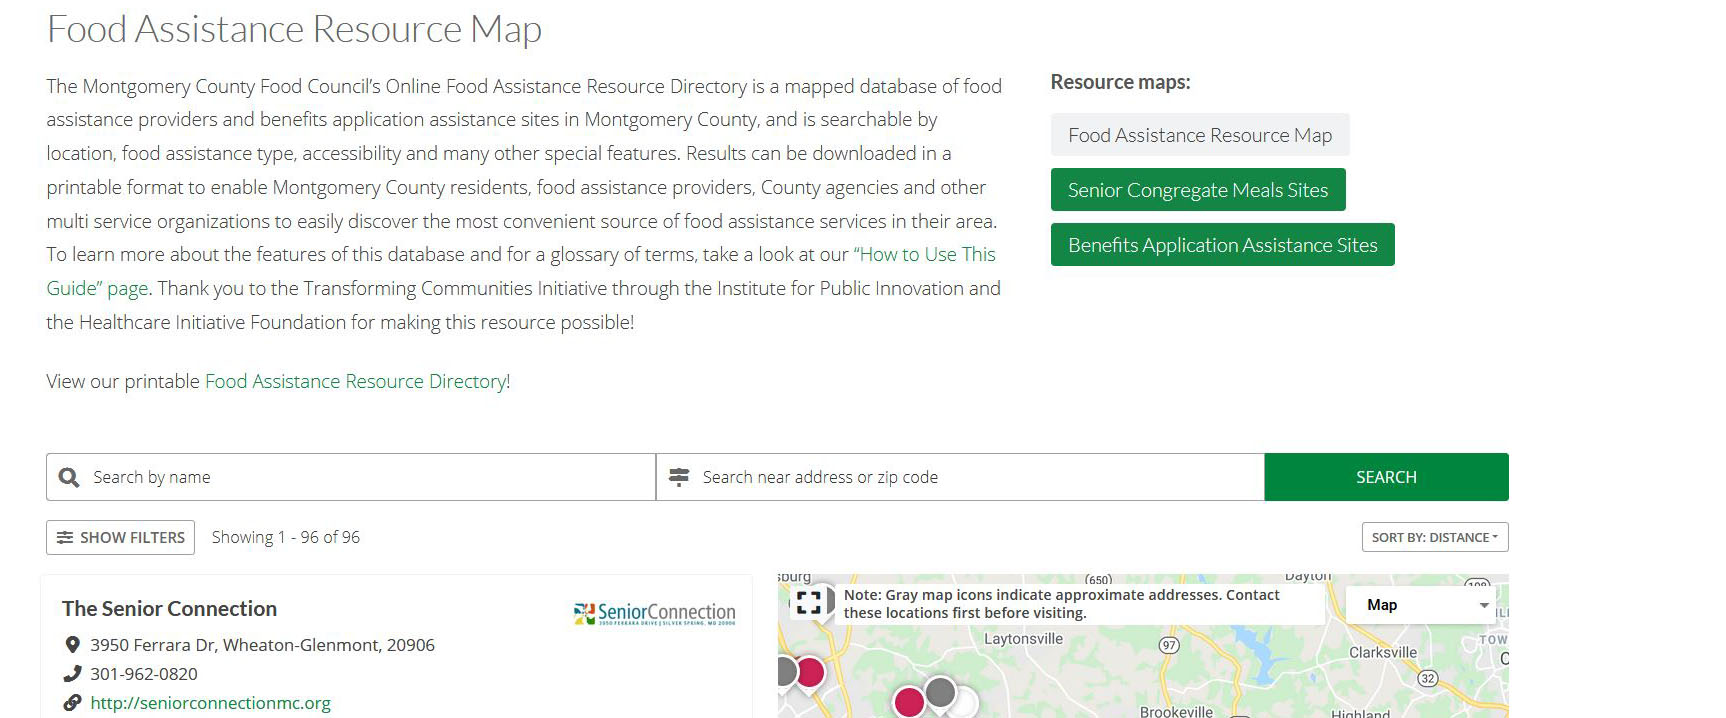
Some food distribution site maps are serving other vulnerable populations, too, such as seniors and adults with disabilities, as well as the general public, including those who have recently lost their jobs and are in need of food assistance.
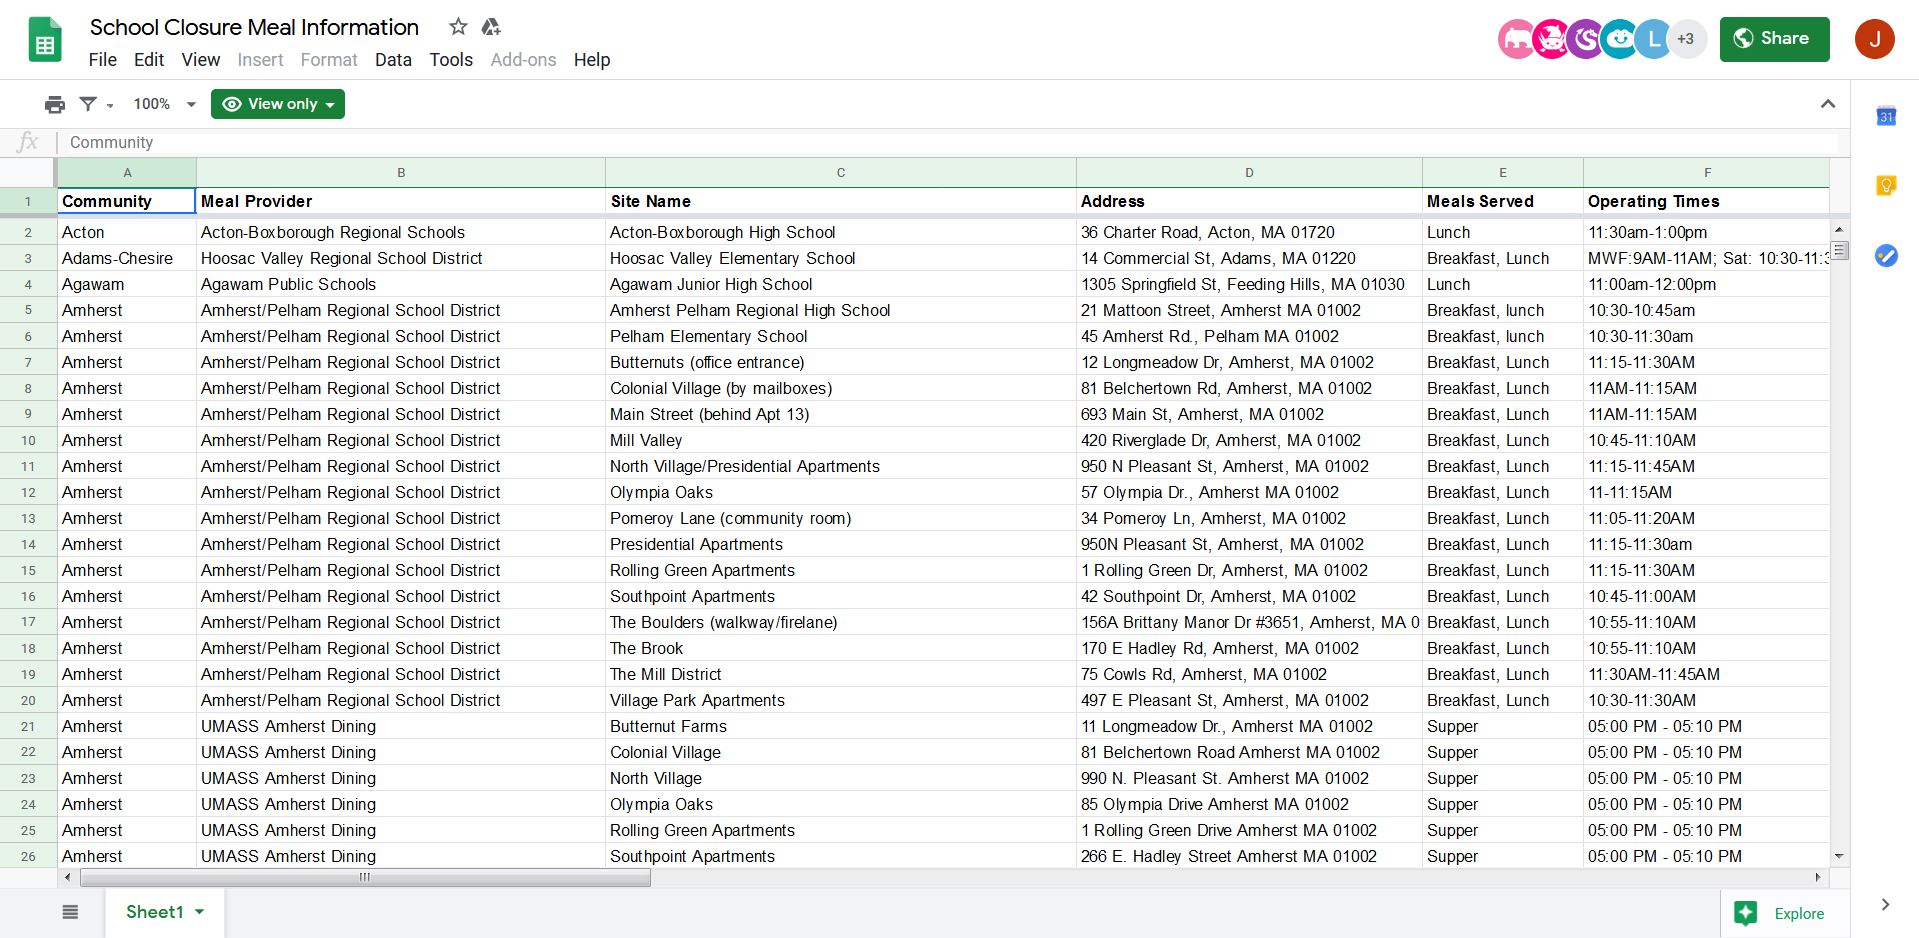
Many of these food distribution site maps are maintained by a county or a city and are therefore limited to a particular jurisdiction. But scaling up data collection and sharing information at the state level can be more complicated. In Maryland, there are 24 counties, including Baltimore City. After schools closed, the state adapted a map that had been used to show summer meal sites; in its new incarnation it shows food distribution sites for students right now. Establishing a process for acquiring up to date site information from each school district took time. In an effort to maintain of a list of sites that changes daily, some organizations are using a combination of google sheets and google maps and asking school districts to add or delete information that then gets displayed on a map.
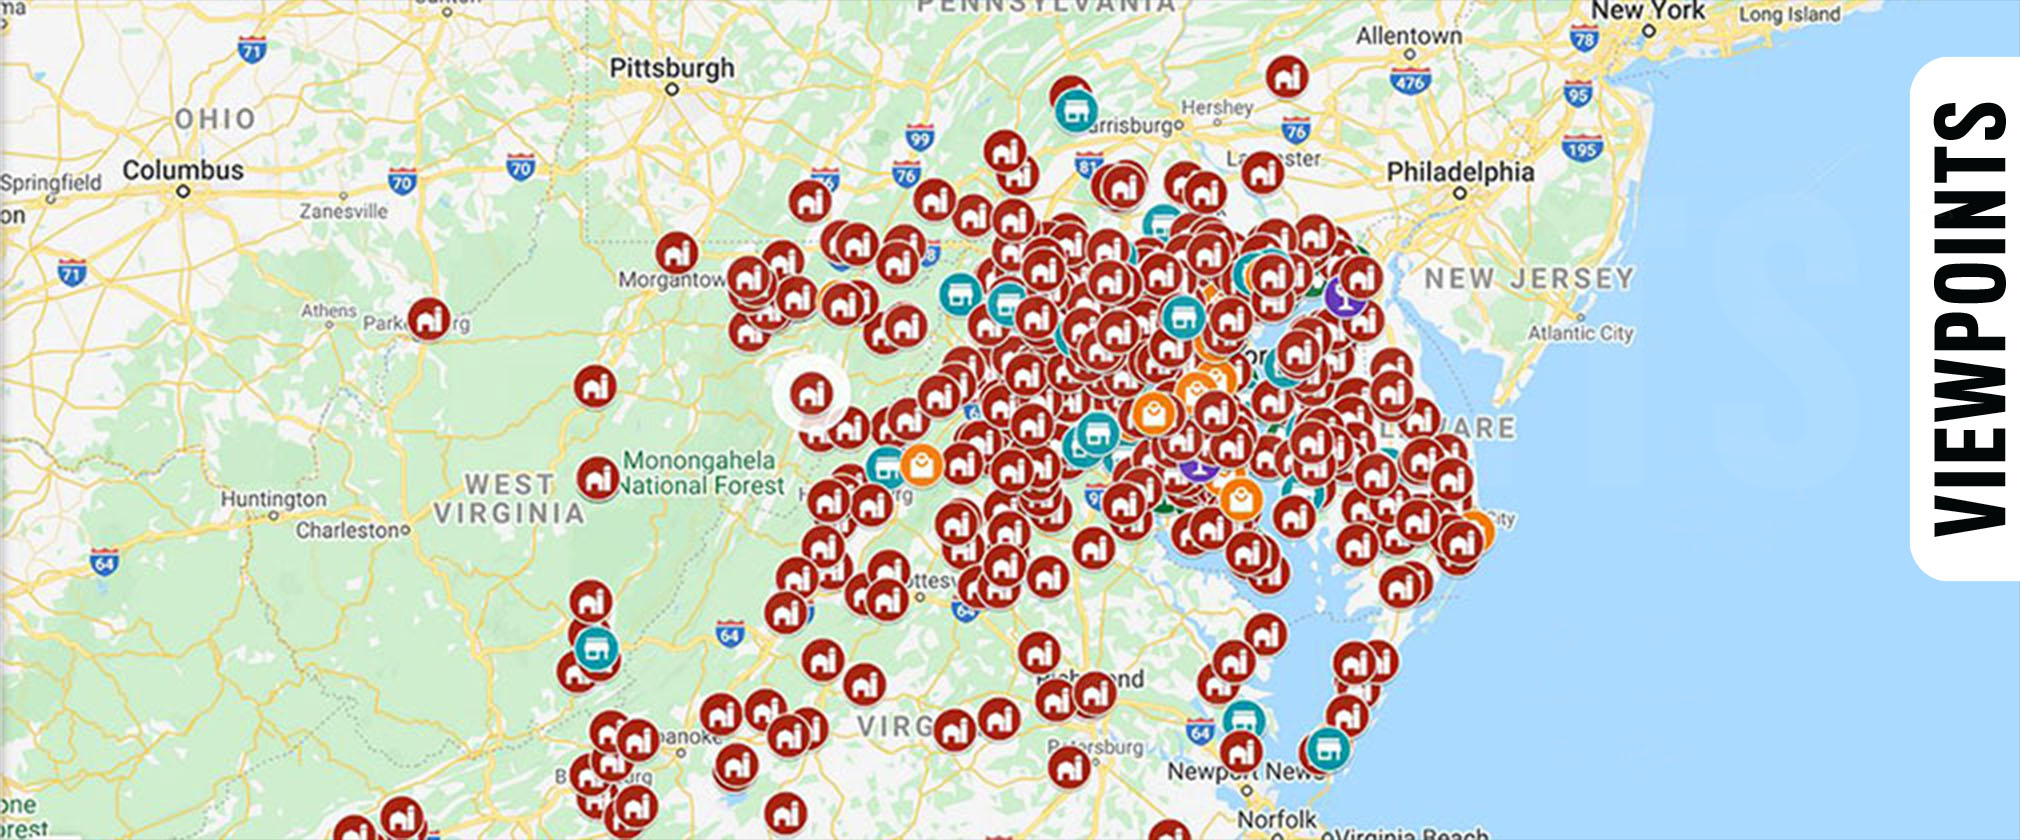
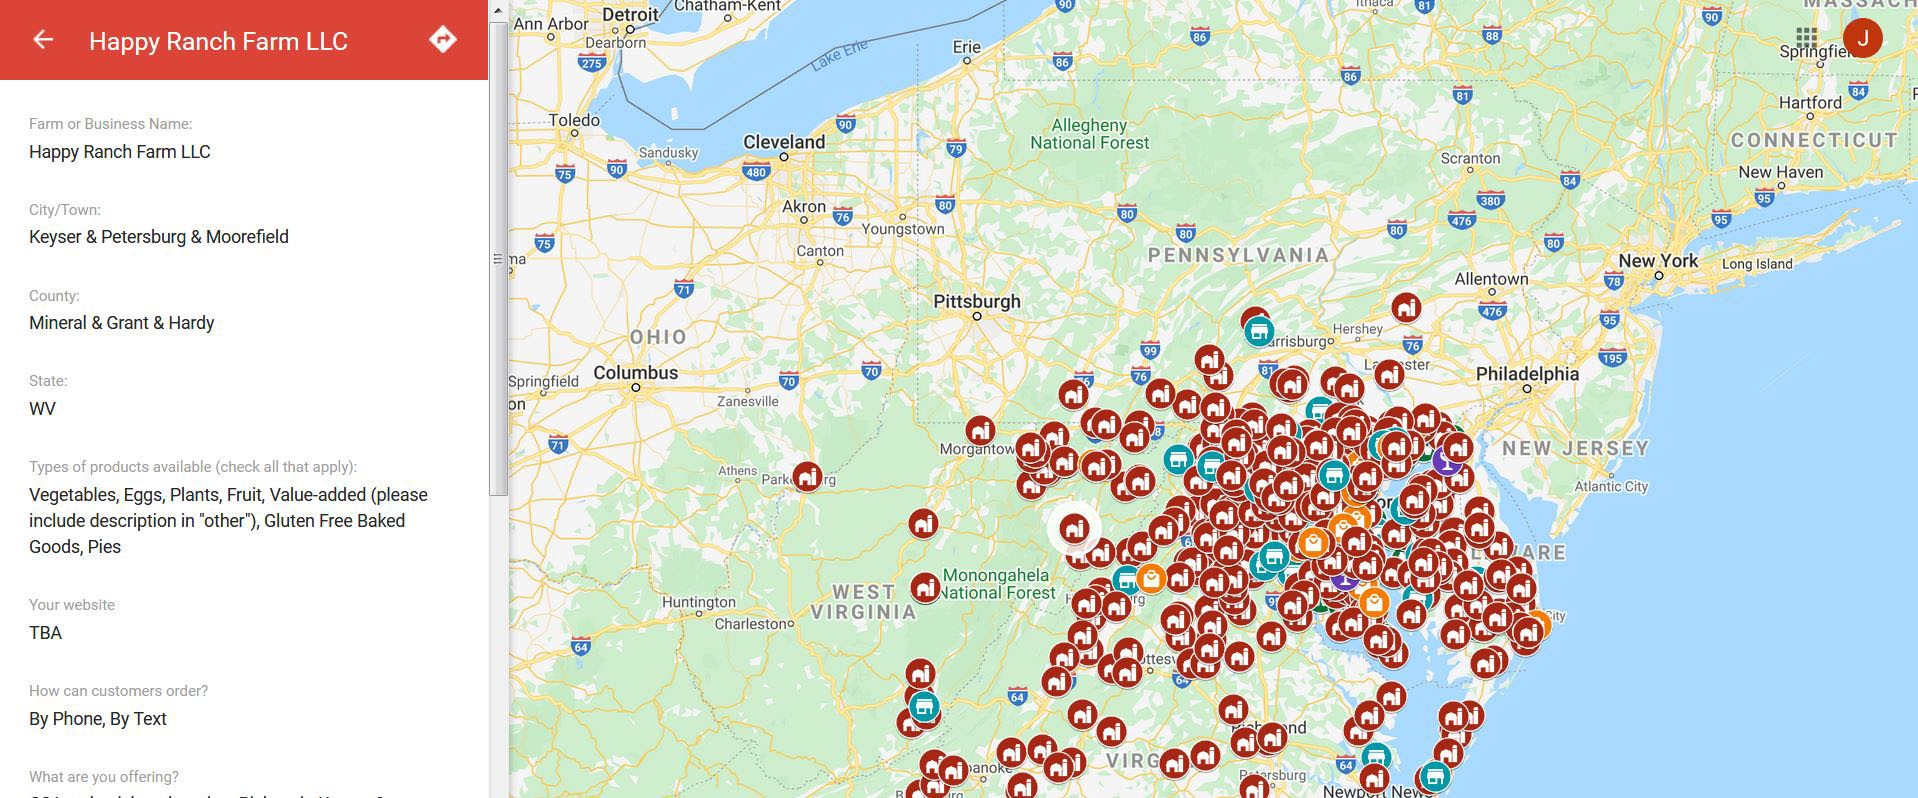
These food distribution maps are only one part of the pandemic response. Maps and dashboards have been used in other aspects of the food system as well. A group in the Mid-Atlantic region used google forms, google sheets and google maps to create the Mid-Atlantic Local Food Resources Map, which shows where to buy local during the current crisis.
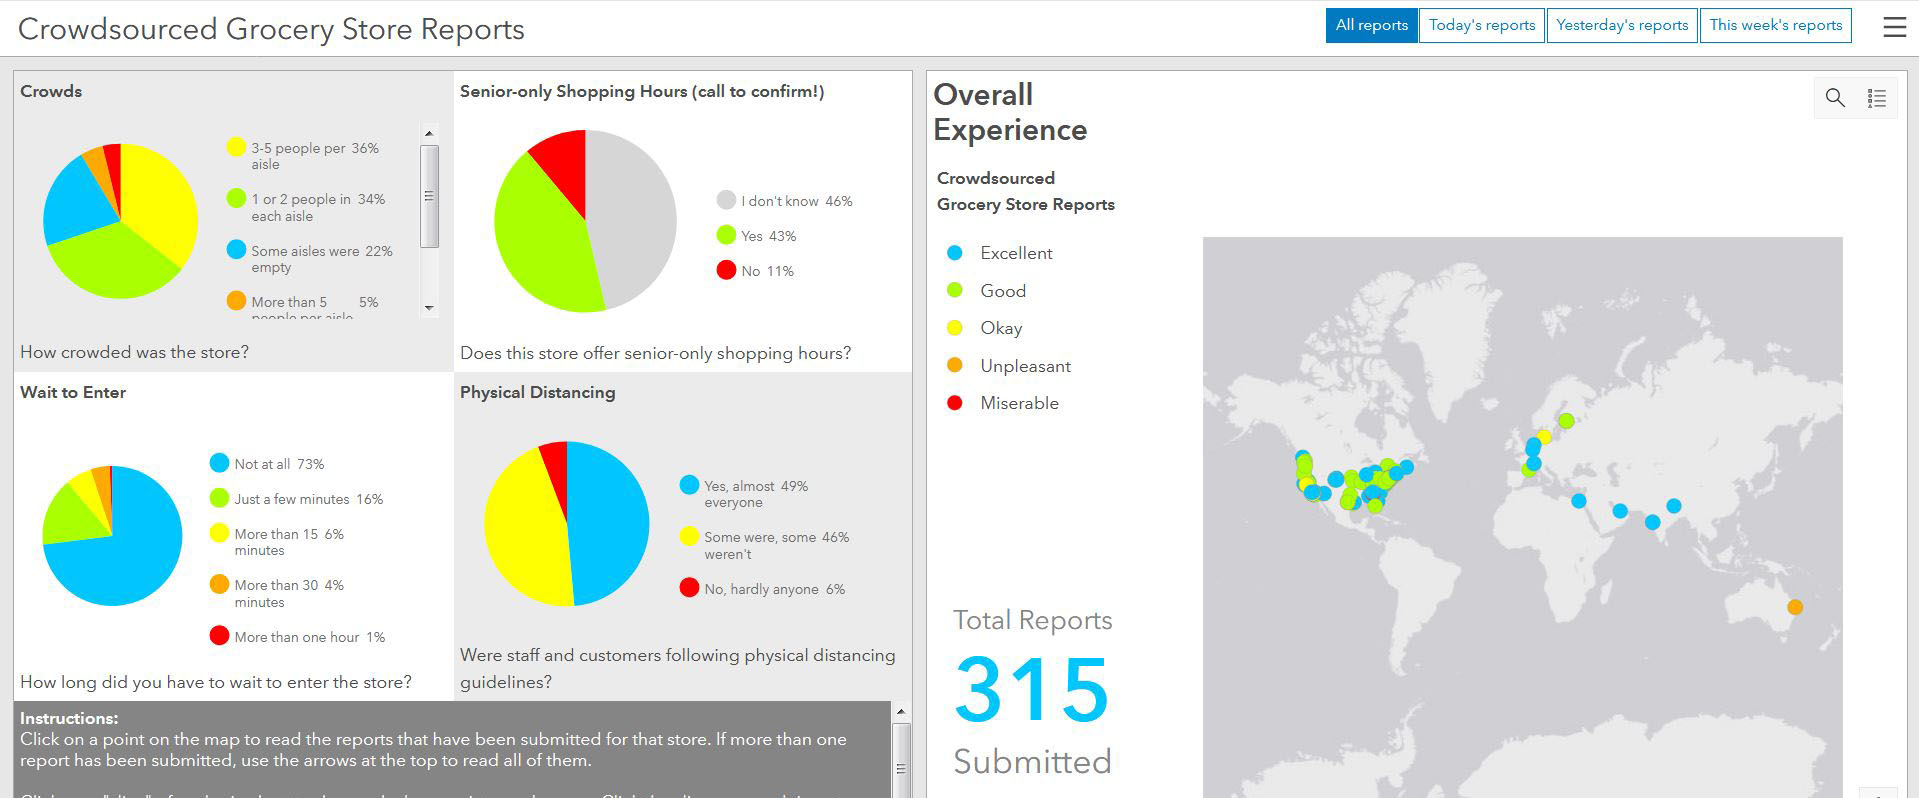
Other groups have been using surveys to create their maps and dashboards. The Yolo Food Bank in California is using map-enabled surveys to connect low-income seniors who need food delivered to their homes with volunteers willing to do emergency food box home deliveries. Baltimore County, Maryland, has created a map using self-reported (i.e., crowd-sourced) data from local restaurants, to show where residents can buy meals to-go while restaurants are closed for dine-in service. Holly Torpey, from GISCorps, a program that offers volunteer GIS services to under-served communities worldwide, created a dashboard that allows people to report on their experiences at grocery stores, including what safety measures were in practice and what items were in or out of stock. All three of these unique examples use a product called Survey123 for ArcGIS to collect and map information.
Many of these maps and dashboards were created very quickly to help connect people to much needed resources. There is already evidence that these efforts could have some unintended consequences. Some sites listed on these maps have been overwhelmed, as we see long lines at food pantries, and some farms who participate in direct-buy programs having to already stop taking on new customers and cut back on orders.
Over the next few weeks these maps and dashboards will need to evolve with the COVID-19 crisis. They will have to account for a growing number of people who need assistance at all stages of the food system. Part of this will require getting access to better and more reliable data. They will also have to add tools that will track change over time. Decision makers will want to know where resources are being allocated, in what quantities, and where shortfalls are occurring. These tools will help us as the crisis progresses and will inform the food system long after the crisis is over.
Images courtesy of: Baltimore City - Food Distribution Site Map; Montgomery County Food Council - Food Assistance Resource Map; Project Bread - MA Meal Sites During School Closures Map; MDFMA, Future Harvest, and Metropolitan Washington Council of Governments – Mid-Atlantic Local Food Resources Map; Holly Torpey – Crowdsourced Grocery Store Reports